MCP-Bastion Documentation
Dashboard & observability
Live: https://vaquarkhan.github.io/MCP-Bastion/guide/observability.html
This page covers the local dashboard, built-in metrics/audit hooks, and whether you need OpenTelemetry (OTEL).
Short answer: do you need OpenTelemetry?
No — not required. MCP-Bastion is designed for zero-infra observability first.
| Layer | Required? | What you get |
|---|---|---|
Dashboard (mcp-bastion dashboard) |
Optional | Human UI: KPIs, posture, attack matrix, FinOps, forensics |
Prometheus /metrics |
Optional | Scrape counters (blocks, PII, vault, latency) into Grafana/AMP |
| Audit JSONL + alerts | Recommended in prod | SOC/SIEM-friendly event trail; Slack/HTTP webhooks |
| OpenTelemetry OTLP | Optional | Spans into an existing APM (Jaeger, Datadog, Honeycomb, ADOT, …) |
Use OTEL only if you already run a tracing backend and want Bastion tool-call spans beside the rest of your services.
If you do not have OTEL today, start with dashboard + Prometheus + audit — that is enough for security/FinOps operators.
Setup when you want it: OTEL.md · pip install mcp-bastion-python[otel] · set OTEL_EXPORTER_OTLP_ENDPOINT.
Observability stack (how pieces fit)
MCP tool calls
      │
      ▼
MCP-Bastion middleware / proxy
      │
      ├── MetricsStore ──► Dashboard UI ──► /metrics (Prometheus)
      ├── Audit JSONL  ──► SIEM / `mcp-bastion report` / posture drift
      ├── Alerts       ──► Slack / HTTP webhooks
      └── (optional) OTEL spans ──► OTLP collector / APM
Same policy (bastion.yaml) drives blocks; observability only records what happened.
Deep SIEM / fleet patterns: SECURITY_OBSERVABILITY.md
Effectiveness numbers: METRICS.md
Dashboard features (full board)
Zero-infra local UI — no login, no DB, no cloud.
mcp-bastion dashboard                 # LIVE (empty until MetricsStore is fed in-process)
mcp-bastion dashboard --demo          # seed simulated traffic scenarios (or UI toggle / dashboard.demo: true)
## open http://127.0.0.1:7000/
Demo vs live: Default is live. Demo seeds demo_traffic_scenarios.json for validation/tour; toggle off (UI, --no-demo, or dashboard.demo: false) clears synthetic data.
Connect live production data (checklist)
| Path | Steps |
|---|---|
| Tour | UI Demo data toggle, or --demo |
| Python live | audit.enabled: true + Bastion middleware; dashboard must share that same process (MetricsStore is in-memory) |
| Bridge | POST /api/ingest-block with {"reason","tool"} into the dashboard host |
UI: status-bar ⓘ + empty-state card. Long form: dashboard/README.md · CONNECT_LIVE.md.
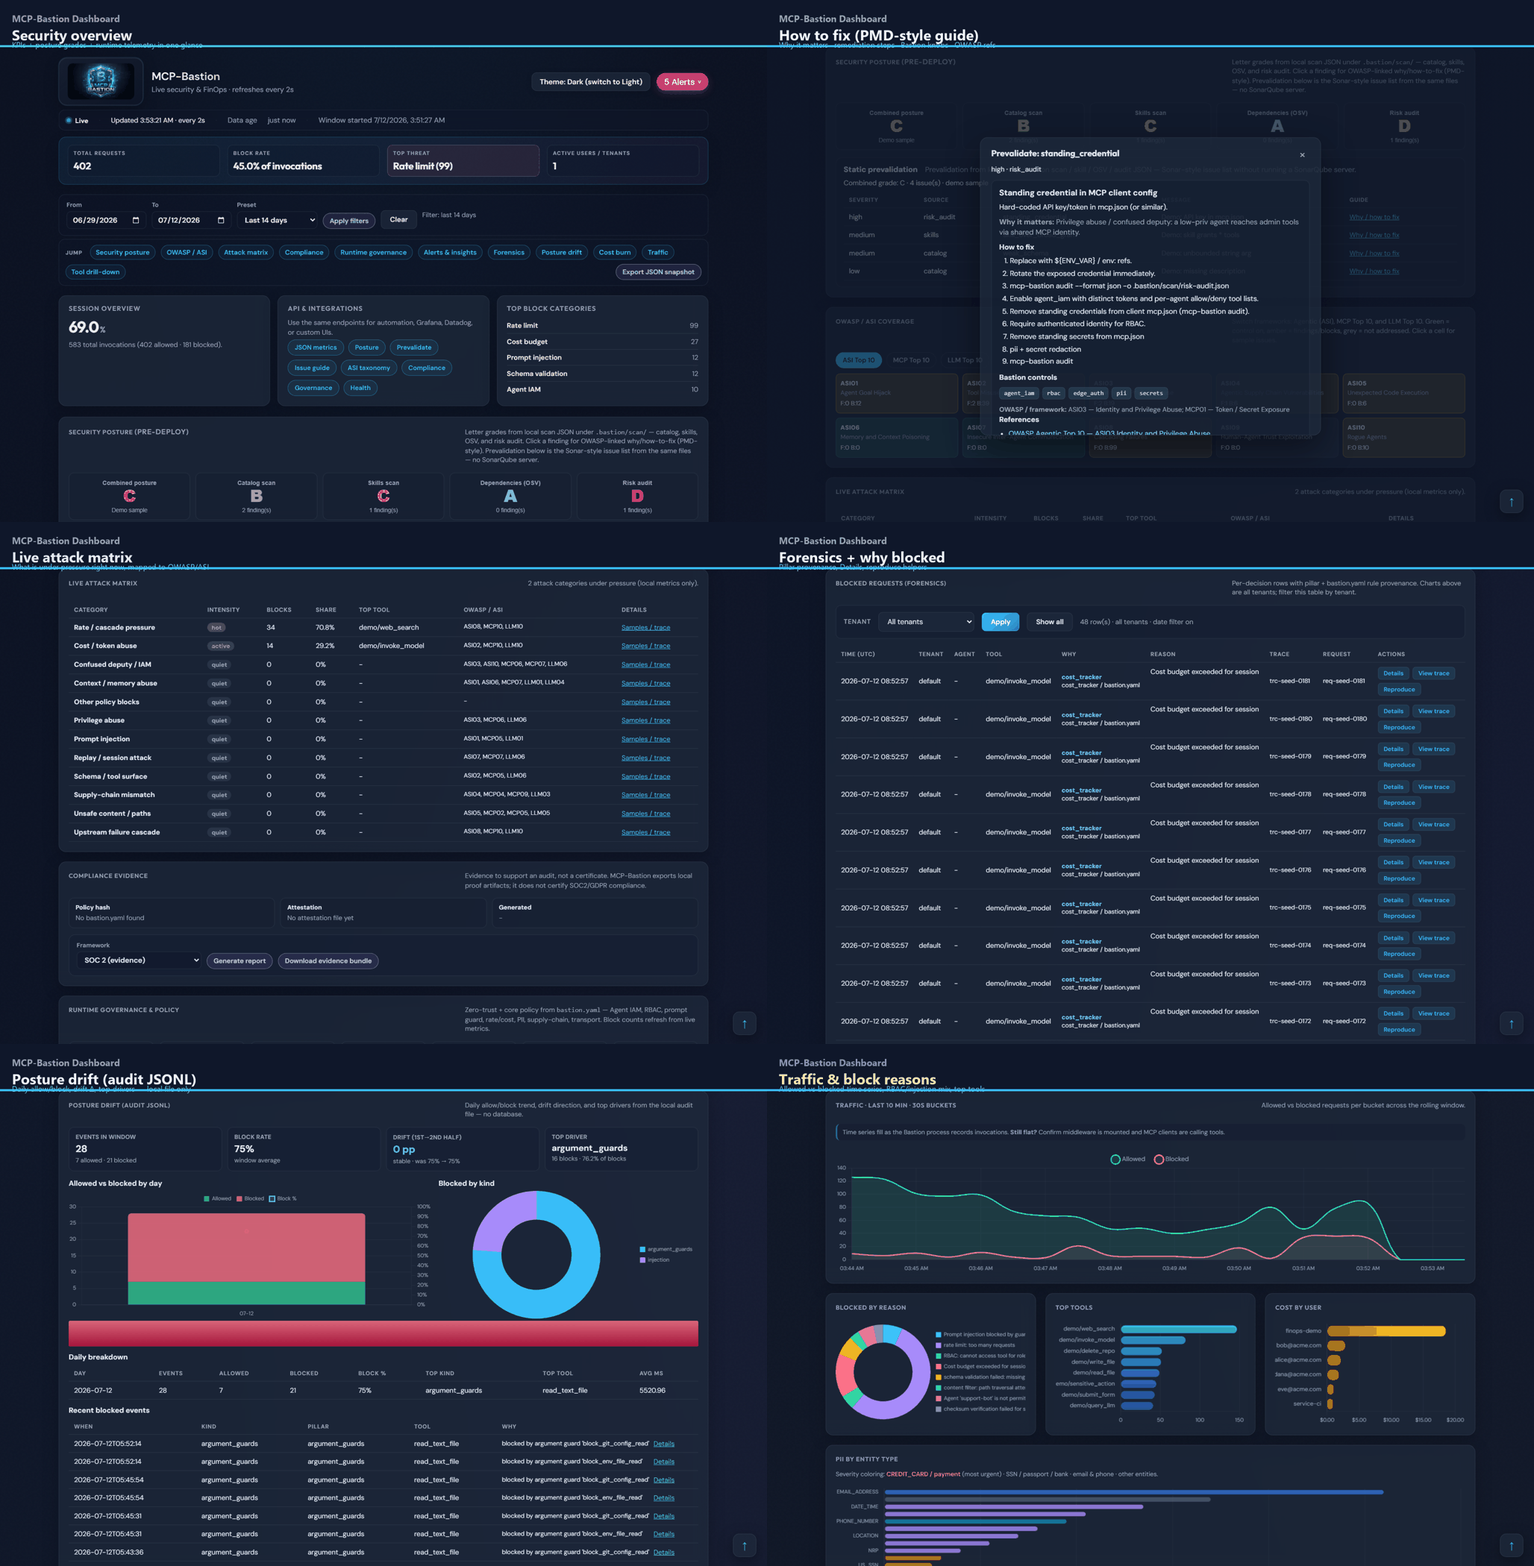
| Panel / capability | What it shows | Why it matters |
|---|---|---|
| Overview KPIs | Requests, block %, top threat, users/tenants | Instant “are we under pressure?” |
| Pillar health | Which guards are live vs idle | Config ↔ runtime alignment |
| Security posture A–F | Worst finding severity → letter: A info/clean · B low · C medium · D high · F critical (from scan / osv-scan / audit JSON) |
Pre-deploy ship/no-ship |
| Static prevalidation | Sonar-style issue list | Fix catalog smells before runtime |
| Issue guides | Why / fix steps / Bastion knobs / OWASP | Turns findings into YAML changes |
| OWASP / ASI / MCP / LLM heatmaps | Coverage tabs | Map pillars to taxonomies |
| Live attack matrix | Category pressure + samples | SOC-style situational awareness |
| Runtime governance tiles | RBAC, prompt, rate/cost, PII, IAM, transport | Policy readable by non-devs |
| Cost burn & reduction | Actual vs would-have-been; tokens avoided | FinOps ROI of blocks |
| Posture drift | Daily allow/block from audit JSONL | Catch regressions after changes |
| Forensics | Why blocked + Trace / Reproduce | Faster incident review |
| Agents | Denied-by-agent + IAM scope map | Confused-deputy visibility |
| Alerts / insights | SSE alerts + anomalies | Page into Slack/ops |
| Observe banner | Would-have-blocked counts | Safe rollout (mode: observe) |
| Compliance evidence | Hashes + SOC2/GDPR/ISO/NIST packs | Auditor-friendly exports |
Prometheus /metrics |
Scrape from dashboard process | Grafana without a separate agent |
| Date filters / onboarding | Scope + first-run checklist | Usability |
UI details and screenshots: dashboard/README.md
Feature deep dive Part F: FEATURE_DEEP_DIVE.md
Built-in observability (no OTEL)
1. Metrics + Prometheus
- Dashboard JSON APIs (
/api/metrics, posture, forensics, …) - Prometheus text:
GET http://127.0.0.1:7000/metrics - Includes pillar counters and vault series (
mcp_bastion_pii_vault_*) when enabled
See METRICS.md.
2. Audit trail
audit:
  enabled: true
  jsonl_path: .bastion/audit.jsonl
- Who / what / allow vs block / reason
- Feeds dashboard posture drift,
mcp-bastion report, compliance packs - Optional hash chain / telemetry sinks for SIEM (SECURITY_OBSERVABILITY.md)
3. Alerts
alerts:
  # Slack / HTTP webhook targets — see POLICY_AS_CODE.md
Real-time notify when blocks or thresholds fire.
4. Observe / shadow mode
mode: observe # would-block without denying
Dashboard observe banner shows would-have-blocked counts — tune before enforce.
OpenTelemetry (optional)
| When to enable | You already have Jaeger / Tempo / Datadog / Honeycomb / ADOT / etc. |
| When to skip | Solo / small team; dashboard + Prometheus is enough |
| What it adds | Per-tools/call span: tool name, action, latency, error when blocked |
| What it does not replace | Dashboard, Prometheus scrape, or audit JSONL |
pip install "mcp-bastion-python[otel]"
export OTEL_EXPORTER_OTLP_ENDPOINT=http://localhost:4317
Full notes: OTEL.md.
Recommended setups
| Environment | Enable |
|---|---|
| Laptop / first demo | mcp-bastion dashboard --demo only |
| Team MCP (prod-ish) | Dashboard + audit JSONL + Prometheus scrape |
| Enterprise / SOC | Above + alerts webhooks + SIEM sink (SECURITY_OBSERVABILITY.md) |
| Existing APM estate | Above + optional OTEL OTLP |
Quick commands
## Dashboard
mcp-bastion dashboard --demo

## Prometheus scrape (while dashboard running)
curl -s http://127.0.0.1:7000/metrics | head

## Optional OTEL
pip install "mcp-bastion-python[otel]"
export OTEL_EXPORTER_OTLP_ENDPOINT=http://localhost:4317
Related
| Doc | Topic |
|---|---|
| dashboard/README.md | UI panels & tour GIFs |
| METRICS.md | Overhead & effectiveness |
| OTEL.md | OTLP setup |
| SECURITY_OBSERVABILITY.md | OWASP map, SIEM, fleet |
| DEMOS.md | Dashboard demo section |
| DOCUMENTATION_HANDBOOK.md | Visual handbook |